Check out the data in Table 1 on the youth vote in battleground states in 20161. The average voter turnout for 18-24 year olds was a dismal 43%. Almost two million youth from 18-34 years old didn’t vote in the close election. As discussed in a previous blog, the Democrats should have gained about 22 votes for every 100 new youth votes. The youth vote could have easily swung these swing states if they voted.
Table 1: Youth Vote Turnout in 2016
| State | 18-24 Year Old Voter Turnout | Total Voter Turnout | 18-34 Year Olds That Didn’t Vote |
| Michigan | 37.8% | 64.3% | 1,104,000 |
| Wisconsin | 47.1 % | 70.5% | 589,000 |
| Pennsylvania | 51.4% | 62.6% | 1,237,000 |
| Florida | 37.3% | 59.9% | 1,974,000 |
| Arizona | 40.2% | 60.4% | 743,000 |
| US Total | 43.0% | 61.4% | 15,353,000 |
Only 43% of youth from 18-24 voted in 2016. Over fifteen million youth didn’t vote and Hillary still got almost 3 million more votes than Trump.
If a Get out the Vote effort got 20% more youth to vote, Michigan, Wisconsin and Pennsylvania would have swung Democratic. Hillary would have won the Electoral College by 278-260. Getting 20% of the youth to vote could be a challenge, but little differences add up in a close race.
Table 2: Results With 20% More Youth Vote
| State | 20% of 18-34 Nonvoters | Democratic Votes Gained | Clinton Lost By |
| Michigan | 220,800 | 48,000 | 10,704 |
| Wisconsin | 117,800 | 25,900 | 22,748 |
| Pennsylvania | 247,400 | 54,000 | 44,292 |
| Florida | 394,800 | 87,000 | 112,911 |
| Arizona | 148,600 | 32,000 | 91,234 |
| US | 3,070,000 | 1,465,000 | -2,868,519 |
This table shows that if 20% more of the youth would have voted in 2016, then Michigan, Wisconsin and Pennsylvania would have flipped to Clinton.
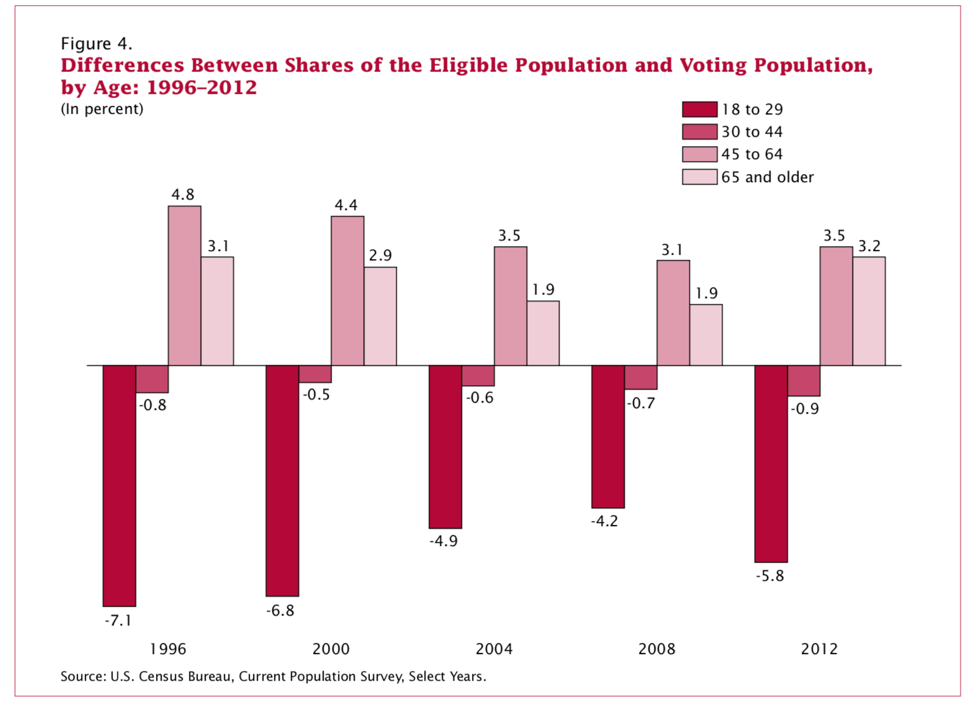
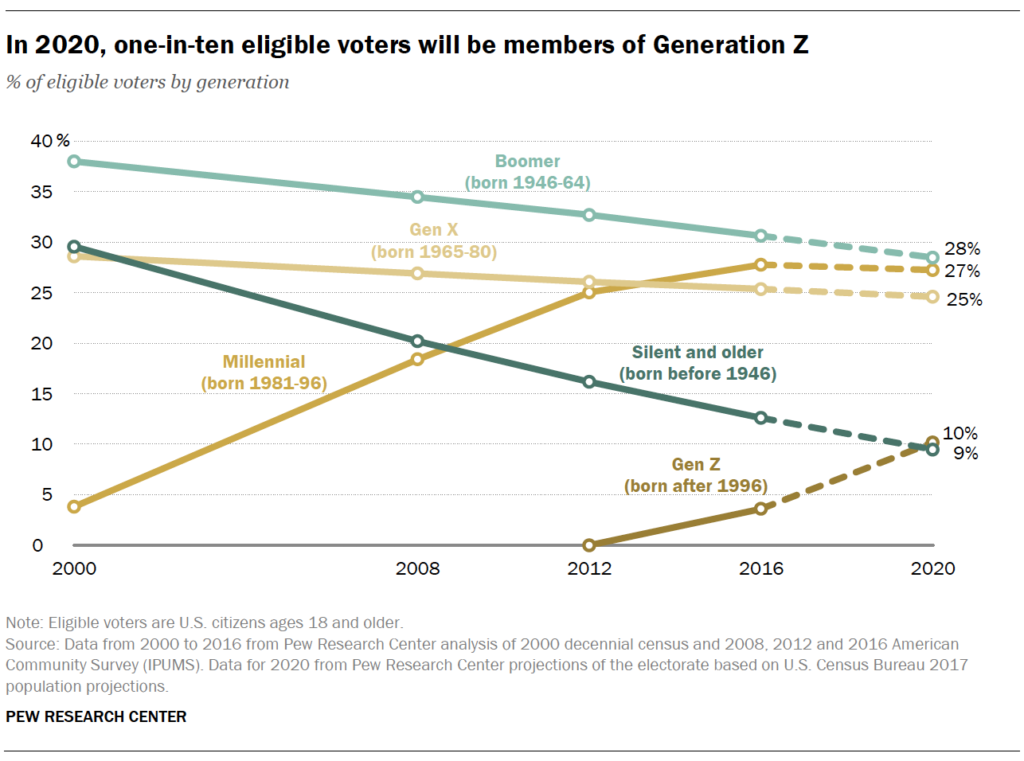
In 2020, there will be 19 million more Gen Z voters than in 20162. Gen Z eligible voters are more liberal than older generations and 45% non-white4. Gen Z will outnumber everyone born before the Baby Boomers as shown in Figure 2. The problem is that youth are under-voters. Under-voters are groups of people that vote less than their peers. Older voters are over-voters because they outvote their peers. Figure 1 shows how they youth vote have under-voted over the decades.
Figure 1: Under And Over-Voting by Age

This figure shows how the youth usually under-vote by about 5% while elderly voters over-vote by 3-4%. The difference decreased in 2016.
In 2016, the youth vote of 18-24 year olds made up 12% of the voting population, but they only voted like they were 8.4%. That means they under-voted by 3.6% and that’s a lot in close elections. Figure 1 used different age ranges and got different results than what were available from the Census Bureau. It’s a shame that the youth vote doesn’t turn out when they have the most to win or lose from government policies over their lifetimes.
Table 3: Under-voting in the 2016 Election (Populations in thousands)
| Age Range | Total Citizen Population | Total Votes | % of Electorate | % Who Voted | Under-Vote |
| Total | 224,059 | 137,537 | |||
| 18 to 24 | 26,913 | 11,560 | 12.0% | 8.4% | 3.6% |
| 25 to 34 | 38,283 | 20,332 | 17.1% | 14.8% | 2.3% |
| 35 to 44 | 34,327 | 20,662 | 15.3% | 15.0% | 0.3% |
| 45 to 64 | 77,544 | 51,668 | 34.6% | 37.6% | -3.0% |
| 65+ | 46,993 | 33,314 | 21.0% | 24.2% | -3.2% |
This table shows how youth under-vote by about 3% while the elderly over-vote by about 3%.
If the youth would vote, they would be better represented in government. It’s that simple and they need to get the message. The hard part is getting them the message and voting! That will be a topic in a later blog.
Figure 2: 2020 Electorate

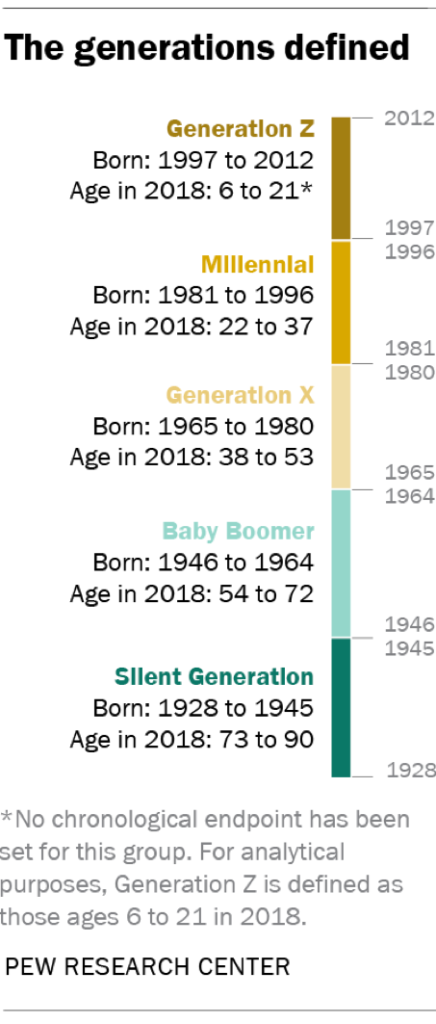
Figure 3: Generations Defined

To sign up for my newsletter, go below…
- https://www.census.gov/data/tables/time-series/demo/voting-and-registration/p20-580.html
- https://skippstrips.com/2019/08/gen-z-voters-will-change-the-2020-election/
- https://www.pewsocialtrends.org/essay/an-early-look-at-the-2020-electorate/
- https://www.pewsocialtrends.org/2019/01/17/generation-z-looks-a-lot-like-millennials-on-key-social-and-political-issues/
